|
Summary
|
|
|
Fund Name
|
UTI Mutual Fund
|
|
Scheme Name
|
UTI Arbitrage Fund-Reg(G)
|
|
AMC
|
UTI Asset Management Company Private Limited
|
|
Type
|
Open ended scheme
|
|
Category
|
Hybrid - Arbitrage Fund
|
|
Launch Date |
29-Jun-06
|
|
Fund Manager
|
Sharwan Kumar Goyal , Amit Sharma
|
|
Face Value
|
10
|
|
Custodian |
Stock Holding Corporation of India Limited.
|
|
Net Assets (Rs. cr)
|
6614.10
|
|
|
|
|
AMC Details |
|
UTI Asset Management Company Private Limited
|
|
UTI Towers, Gn Block,
|
|
Bandra Kurla Complex, Bandra (East)
|
|
Mumbai - 400 051
|
|
Phone :
+91 (22) 66786666
|
|
Fax :
+91 (22) 66786503,56786578
|
|
service@uti.co.in
|
|
www.utimf.com
|
|
|
Registrar & Transfer Agent Details |
|
KFin Technologies Limited
|
|
Selenium Building, Tower-B, Plot No 31 & 32
|
|
Financial District,Nanakramguda, Serilingampally
|
|
Hyderabad - 500 032
|
|
(040) 23312454 23320751 23320752
|
|
(040) 23311968
|
|
customercare@karvy.com
|
|
https://mfs.kfintech.com/
|
|
|
|
|
|
|
|
|
|
NAV Details
|
| |
|
|
NAV Date
|
04-Apr-25 |
Max Entry Load %
|
0.00 |
|
NAV [Rs] |
34.55 |
Max Exit Load %
|
0.25 |
|
Buy/Resale Price [Rs]
|
34.55 |
52 Week High[Rs] |
34.55 (04-Apr-25) |
|
Sell/Repurchase Price [Rs]
|
34.55 |
52 Week Low[Rs]
|
32.20 (09-Apr-24) |
|
|
|
|
|
Nav Graph |
|
|
|
|
|
|
|
|
|
|
|
|
|
|
|
|
|
Investment Details
|
|
Objective |
| The objective of the scheme is to generate capital appreciation through arbitrage opportunities between cash and derivative market and arbitrage opportunities within the derivative segment and by deployment of surplus cash in debt securities and money market instruments. However, there can be no assurance or guarantee that the investment objective of the scheme would be achieved. |
|
|
|
Min. Investment(Rs.)
|
5000 |
|
Increm.Investment(Rs.)
|
1000 |
|
|
|
Investment Pattern |
| Type | Minimum % | Maximum % | | Derivatives including Index Futures, Stock Futures, Index Options and Stock Options | 65 | 100 | | Equity & Equity related instruments | 65 | 100 | | Money Market, Debt instruments, Securitized debt and call money. | 0 | 35 |
|
|
|
|
SIP Details |
|
|
SIP MIN Investments(Rs.) |
500 |
|
SIP Incremental Investments(Rs.) |
1 |
|
SIP Frequency |
Daily |
|
No.of Investments Cheques
|
|
|
|
|
|
|
|
Ratio
|
| |
|
Statistical Ratios |
|
|
|
|
Standard Deviation [%] |
1.0833
|
|
Semi Standard Deviation [%] |
0.0439
|
|
Beta [%] |
-0.0702
|
|
Sharpe Ratio [%] |
1.1781
|
|
R-Square [%] |
-0.1149
|
|
Expense Ratio [%] |
0.7500
|
|
AVG Ratio [%] |
0.0319
|
|
|
|
|
Other Ratios |
|
|
|
|
Jenson Ratio [%] |
0.0139
|
|
Treynor Ratio [%] |
-0.1822
|
|
Turnover Ratio [%] |
12.0000
|
|
FAMA Ratio [%] |
0.0089
|
|
SORTINO Ratio [%] |
0.3518
|
|
|
|

|
What is Standard Deviation?
Standard Deviation is the measure of the deviation in the returns of the portfolio. In Simple Words it tells us how much the return on the fund is deviating from the expected normal return.
|
|
|
What is Jenson's Alpha?
It measures whether the Scheme is generating excess returns over the normal returns.For example, if there are two mutual funds that both have a 12% return, a rational investor will want the fund that is less risky.If the value is positive, then the portfolio is earning excess returns. In other words, a positive value for Jensen's alpha means a fund manager has 'beat the market' w with his or her stock picking skills. The Higher the value the better the performance.
|
|
|
|
|
|
|
Portfolio Analysis
|
|
|
|
Allocations As on
31-Mar-2025
|
|
|
|
Fund Size :
6614.10
(Cr.) |
|
|
|
 |
|
 |
|
|
|
Market cap-wise Allocation Style |
|
|
|
Average Mkt Cap (Rs Cr) |
155313.78
|
|
Market Capitalization |
% of Portfolio
|
|
Large |
63.92
|
|
Mid |
NA
|
|
Small |
NA
|
|
Note: Large-Cap = 5000 Crs. and above, Mid-Cap = 2000 Crs. to 5000 Crs. and
Small-Cap = less than 2000 Crs. |
|
|
|
|
|
|
Portfolio Concentration |
|
|
% Net Assets
|
|
Top 3 Sectors |
23.77 |
|
|
|
+ - Top 5 Holdings |
30.89 |
| Reliance Industries | 5.03 | | Net Current Asset | 4.92 | | ICICI Bank | 4.12 | | PNB | 2.57 | | HDFC Bank | 2.44 |
|
|
+ - Top 10 Holdings |
41.47 |
| Reliance Industries | 5.03 | | Net Current Asset | 4.92 | | ICICI Bank | 4.12 | | PNB | 2.57 | | HDFC Bank | 2.44 | | Bank Of Baroda | 2.30 | | Ultratech Cement | 1.71 | | Infosys | 1.57 | | Vedanta | 1.41 | | SBI | 1.31 |
|
|
|
|
|
 MF UNITS UTI-MONEY MARKET FUND
|
13.91
|
|
Reliance Industries Ltd.
|
5.03
|
|
Net Current Asset
|
4.92
|
 ICICI Bank Ltd.
|
4.12
|
|
CD - HDFC BANK - 04/11/2025
|
2.90
|
|
Punjab National Bank
|
2.57
|
|
HDFC Bank Ltd.
|
2.44
|
|
Bank Of Baroda
|
2.30
|
|
Ultratech Cement Ltd.
|
1.71
|
|
Infosys Ltd.
|
1.57
|
|
|
  Indicates an increase or decrease or no change in holding since last portfolio Indicates an increase or decrease or no change in holding since last portfolio |
 Indicates a new holding since last portfolio. Indicates a new holding since last portfolio. |
 |
|
|
|
|
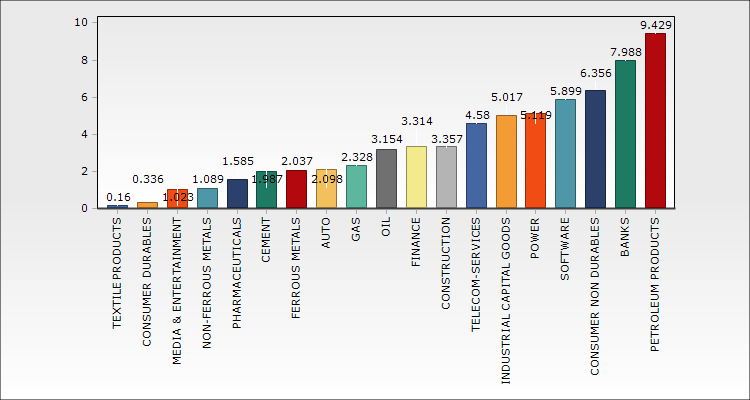
Sector Allocation * (as % of equity portfolio) |
|
|
|
Sector Allocation
Chart Type : |
 |
|
*Pertains to the equity investments only. |
|
|
|
|
|
|
|
|
|
|
In / Out
|
| |
| What's in as on 31-Mar-2025 |
|
What's out as on 31-Mar-2025 |
| Company Name | Mkt Value | Holdings | | (Rs.Cr) | % | | Dabur India Ltd. | 0.7598 | 0.0115 | | Hindustan Petroleum Corporation Ltd. | 0.8027 | 0.0121 | | HFCL Ltd. | 2.9216 | 0.0442 | | Hindustan Zinc Ltd. | 2.3765 | 0.0359 | | The Ramco Cements Ltd. | 5.107 | 0.0772 | | Patanjali Foods Ltd. | 1.8446 | 0.0279 | | Shree Cement Ltd. | 3.6604 | 0.0553 | | Escorts Kubota Ltd. | 6.9226 | 0.1047 | | Colgate-Palmolive (India) Ltd. | 7.8624 | 0.1189 | | The Indian Hotels Company Ltd. | 2.7564 | 0.0417 | | Balkrishna Industries Ltd. | 3.219 | 0.0487 | | The Phoenix Mills Ltd. | 0.4601 | 0.007 | | Eicher Motors Ltd. | 5.3343 | 0.0807 | | Indian Oil Corporation Ltd. | 3.673 | 0.0555 | | National Aluminium Company Ltd. | 0.5266 | 0.008 | | Jindal Steel & Power Ltd. | 13.6275 | 0.206 | | NBCC (India) Ltd. | 0.19 | 0.0029 | | One97 Communications Ltd. | 7.0785 | 0.107 | | Dixon Technologies (India) Ltd. | 2.8336 | 0.0428 | | Persistent Systems Ltd. | 2.3709 | 0.0358 | | Life Insurance Corporation of India | 0.5976 | 0.009 | | PNB Housing Finance Ltd. | 2.1773 | 0.0329 | | Inox Wind Ltd. | 1.1568 | 0.0175 | | SBI Cards And Payment Services Ltd. | 7.1193 | 0.1076 | | Adani Green Energy Ltd. | 0.8538 | 0.0129 | | Dalmia Bharat Ltd. | 8.3154 | 0.1257 |
|
|
| Company Name | Mkt Value | Holdings | | (Rs.Cr) | % | | Wipro Ltd. | 0.3332 | 0.0052 | | The Federal Bank Ltd. | 5.5062 | 0.0858 | | HCL Technologies Ltd. | 34.5093 | 0.538 | | Britannia Industries Ltd. | 0.046 | 0.0007 | | L&T Technology Services Ltd. | 11.061 | 0.1724 | | Muthoot Finance Ltd. | 2.9326 | 0.0457 | | Avenue Supermarts Ltd. | 8.0163 | 0.125 | | HDFC Life Insurance Company Ltd. | 9.1032 | 0.1419 |
|
|
|
|
|
|
|


