|
Summary
|
|
|
Fund Name
|
Aditya Birla Sun Life Mutual Fund
|
|
Scheme Name
|
Aditya Birla SL Digital India Fund(G)
|
|
AMC
|
Aditya Birla Sun Life AMC Limited
|
|
Type
|
Open ended scheme
|
|
Category
|
Equity - Sectoral Fund - Technology
|
|
Launch Date |
15-Jan-00
|
|
Fund Manager
|
Kunal Sangoi , Dhaval Joshi
|
|
Face Value
|
10
|
|
Custodian |
Citibank N.A
|
|
Net Assets (Rs. cr)
|
4530.17
|
|
|
|
|
AMC Details |
|
Aditya Birla Sun Life AMC Limited
|
|
One World Center , Tower 1, 17th Floor, Jupiter Mill Compound,
|
|
Senapati Bapat Marg, Elphinstone Road,
|
|
Mumbai - 400 013
|
|
Phone :
022-43568000
|
|
Fax :
022-43568110/ 8111
|
|
care.mutualfunds@adityabirlacapital.com
|
|
https://mutualfund.adityabirlacapital.com/
|
|
|
Registrar & Transfer Agent Details |
|
Computer Age Management Services Limited
|
|
178 / 10, Kodambakkam High Road,
|
|
Opp. Palmgroove Hotel, M.G.R. Salai, Nungambakkam,
|
|
Chennai - 600 034
|
|
(044) 39115574, 39115583
|
|
(044) 28291521
|
|
camslb@camsonline.com
|
|
www.camsonline.com
|
|
|
|
|
|
|
|
|
|
NAV Details
|
| |
|
|
NAV Date
|
25-Apr-25 |
Max Entry Load %
|
0.00 |
|
NAV [Rs] |
157.00 |
Max Exit Load %
|
1.00 |
|
Buy/Resale Price [Rs]
|
157.00 |
52 Week High[Rs] |
197.62 (13-Dec-24) |
|
Sell/Repurchase Price [Rs]
|
157.00 |
52 Week Low[Rs]
|
144.74 (07-Apr-25) |
|
|
|
|
|
Nav Graph |
|
|
|
|
|
|
|
|
|
|
|
|
|
|
|
|
|
Investment Details
|
|
Objective |
| The objective of long-term growth of capital through a portfolio with a target allocation of 100% equity, focusing on investing in technology and technology dependent companies, hardware, peripherals and components, software, telecom, media, internet and e-commerce and other technology enabled companies. |
|
|
|
Min. Investment(Rs.)
|
1000 |
|
Increm.Investment(Rs.)
|
1000 |
|
|
|
Investment Pattern |
| Type | Minimum % | Maximum % | | Equity & Equity related instruments in technology & technology dependent companies | 80 | 100 | | Equity and Equity related instruments of companies other than technology & technology dependent companies | 0 | 20 | | Debt & Money Market instruments (including securitized debt) | 0 | 20 | | Units issued by REITs & InvITs | 0 | 10 | | Units of MF | 0 | 5 |
|
|
|
|
SIP Details |
|
|
SIP MIN Investments(Rs.) |
100 |
|
SIP Incremental Investments(Rs.) |
1 |
|
SIP Frequency |
Daily |
|
No.of Investments Cheques
|
|
|
|
|
|
|
|
Ratio
|
| |
|
Statistical Ratios |
|
|
|
|
Standard Deviation [%] |
21.9841
|
|
Semi Standard Deviation [%] |
0.6026
|
|
Beta [%] |
0.8488
|
|
Sharpe Ratio [%] |
0.0157
|
|
R-Square [%] |
0.6935
|
|
Expense Ratio [%] |
1.9000
|
|
AVG Ratio [%] |
0.0306
|
|
|
|
|
Other Ratios |
|
|
|
|
Jenson Ratio [%] |
-0.0085
|
|
Treynor Ratio [%] |
0.0041
|
|
Turnover Ratio [%] |
0.3800
|
|
FAMA Ratio [%] |
-0.0069
|
|
SORTINO Ratio [%] |
0.0234
|
|
|
|

|
What is Standard Deviation?
Standard Deviation is the measure of the deviation in the returns of the portfolio. In Simple Words it tells us how much the return on the fund is deviating from the expected normal return.
|
|
|
What is Jenson's Alpha?
It measures whether the Scheme is generating excess returns over the normal returns.For example, if there are two mutual funds that both have a 12% return, a rational investor will want the fund that is less risky.If the value is positive, then the portfolio is earning excess returns. In other words, a positive value for Jensen's alpha means a fund manager has 'beat the market' w with his or her stock picking skills. The Higher the value the better the performance.
|
|
|
|
|
|
|
Portfolio Analysis
|
|
|
|
Allocations As on
31-Mar-2025
|
|
|
|
Fund Size :
4530.17
(Cr.) |
|
|
|
 |
|
 |
|
|
|
Market cap-wise Allocation Style |
|
|
|
Average Mkt Cap (Rs Cr) |
149829.48
|
|
Market Capitalization |
% of Portfolio
|
|
Large |
93.42
|
|
Mid |
0.93
|
|
Small |
NA
|
|
Note: Large-Cap = 5000 Crs. and above, Mid-Cap = 2000 Crs. to 5000 Crs. and
Small-Cap = less than 2000 Crs. |
|
|
|
|
|
|
Portfolio Concentration |
|
|
% Net Assets
|
|
Top 3 Sectors |
90.32 |
|
|
|
+ - Top 5 Holdings |
50.61 |
| Infosys | 19.20 | | Bharti Airtel | 9.79 | | TCS | 9.50 | | Tech Mahindra | 7.42 | | LTIMindtree | 4.70 |
|
|
+ - Top 10 Holdings |
68.38 |
| Infosys | 19.20 | | Bharti Airtel | 9.79 | | TCS | 9.50 | | Tech Mahindra | 7.42 | | LTIMindtree | 4.70 | | HCL Tech. | 4.06 | | Eternal | 4.06 | | Coforge | 3.63 | | Cyient | 3.34 | | Firstsource Solution | 2.68 |
|
|
|
|
|
 Infosys Ltd.
|
19.20
|
|
Bharti Airtel Ltd.
|
9.79
|
 Tata Consultancy Services Ltd.
|
9.50
|
|
Tech Mahindra Ltd.
|
7.42
|
|
LTIMindtree Ltd.
|
4.70
|
|
HCL Technologies Ltd.
|
4.06
|
|
Eternal Ltd.
|
4.06
|
|
Coforge Ltd.
|
3.63
|
|
Cyient Ltd.
|
3.34
|
|
Firstsource Solutions Ltd.
|
2.68
|
|
|
  Indicates an increase or decrease or no change in holding since last portfolio Indicates an increase or decrease or no change in holding since last portfolio |
 Indicates a new holding since last portfolio. Indicates a new holding since last portfolio. |
 |
|
|
|
|
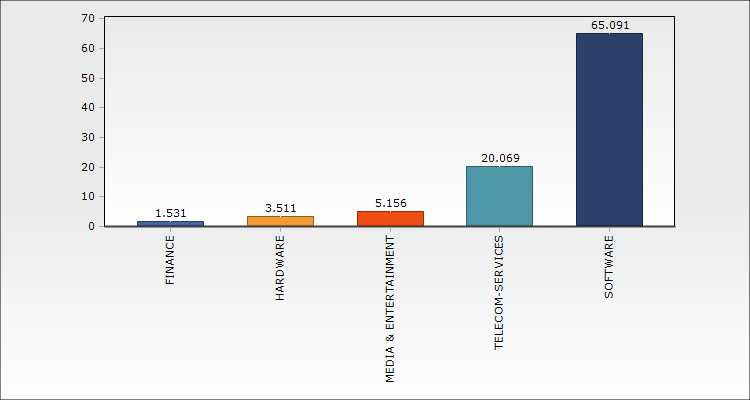
Sector Allocation * (as % of equity portfolio) |
|
|
|
Sector Allocation
Chart Type : |
 |
|
*Pertains to the equity investments only. |
|
|
|
|
|
|
|
|
|
|
In / Out
|
| |
| What's in as on 31-Mar-2025 |
|
What's out as on 31-Mar-2025 |
| Company Name | Mkt Value | Holdings | | (Rs.Cr) | % | | Siemens Ltd. | 26.3768 | 0.5822 | | Mphasis Ltd. | 49.9732 | 1.1031 | | Multi Commodity Exchange Of India Ltd. | 27.6004 | 0.6093 | | One97 Communications Ltd. | 26.7352 | 0.5902 | | TBO Tek Ltd. | 43.1115 | 0.9517 |
|
|
| Company Name | Mkt Value | Holdings | | (Rs.Cr) | % |
|
|
|
|
|
|
|


